


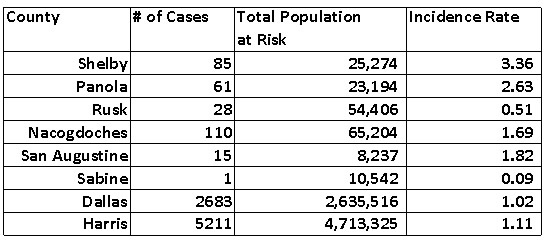
April 24, 2020 - The following charts are comparisons of COVID-19 cases in Shelby County against surrounding counties and two counties with the highest number of cases. Please be advised the Incidence Rate notated in the chart is not a percentage of cases in the county, however, it is an incident rate of cases per 1,000 population during this time of spread of COVID-19. The comparison chart is to demonstrate the relationship of the spread in Shelby County versus the other counties listed.
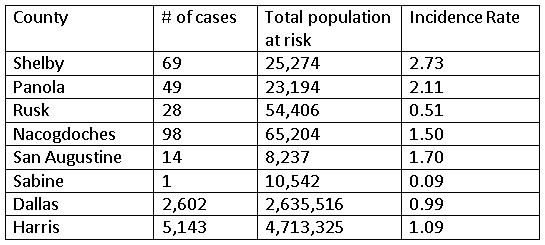
Incidence in epidemiology is a measure of the probability of occurrence of a given medical condition in a population within a specified period of time. Epidemiology is the branch of medicine which deals with the incidence, distribution, and possible control of diseases and other factors relating to health.

April 24, 2020 Incidence Rate Data
The formula for incidence rate is the number of cases divided by the total population and multiply by 1,000.
Number of cases as reported daily by Texas Department of State and Health Services and not the local numbers released during the day.
Number of population is based on internet data from the Census Bureau.
Number of cases does not include the false negatives and patients with Covid 19 who are either asymptomatic (about 30%) and those mild cases (about 12%) who were never tested.
April 23, 2020 Incidence Rate Data
April 22, 2020 Incidence Rate Data